


Lab 7 - Monitoring Todo Application với Spring Boot Actuator và Micrometer
Series: Kubernetes từ Zero đến Production
Tình huống thực tế
Sau Lab 6, DevOps đã có Dashboard theo dõi toàn bộ Kubernetes Cluster.
Dashboard cho biết:
- CPU của Node
- Memory của Pod
- Số lượng Pod
- Restart Count
Một buổi sáng, Product Owner báo:
"Người dùng phản ánh API tạo Todo rất chậm."
Dashboard Kubernetes cho thấy:
- CPU chỉ khoảng 30%
- Memory còn rất nhiều
- Không có Pod Restart
Mọi thứ đều bình thường.
Nhưng người dùng vẫn thấy ứng dụng chậm.
Điều này cho thấy chỉ theo dõi hạ tầng là chưa đủ.
DevOps cần biết:
- API nào đang chậm?
- Có bao nhiêu request mỗi giây?
- Bao nhiêu request bị lỗi?
- JVM đang dùng bao nhiêu Memory?
- Garbage Collector có chạy quá nhiều không?
Đó là lúc Application Monitoring phát huy tác dụng.
Mục tiêu
Sau bài lab này, bạn sẽ:
- Hiểu Application Metrics
- Cài Spring Boot Actuator
- Tích hợp Micrometer
- Export Metrics cho Prometheus
- Cấu hình Prometheus Scrape Application
- Quan sát Request Rate
- Quan sát Request Latency
- Quan sát HTTP Status
- Quan sát JVM Metrics
- Quan sát Garbage Collector
Kiến thức cần chuẩn bị
Đã hoàn thành:
- ✅ Lab 1 → Lab 6
Đã có:
- Kubernetes Cluster
- Prometheus
- Grafana
Kiến trúc
      Browser
         ↓
    Spring Boot
         ↓
     Actuator
         ↓
    Micrometer
         ↓
/actuator/prometheus
         ↓
    Prometheus
         ↓
      Grafana
Lần đầu tiên Prometheus sẽ lấy Metrics trực tiếp từ ứng dụng.
Infrastructure Metrics và Application Metrics
Cho đến Lab 6, chúng ta chỉ có:
CPU

Memory

Network

Restart Count
Đó là Metrics của Kubernetes.
Trong Lab này sẽ có thêm:
HTTP Request

Latency

Status Code

JVM Memory

GC

Thread
Đây mới là dữ liệu giúp DevOps và Developer phân tích hiệu năng của ứng dụng.
Bước 1. Thêm Spring Boot Actuator
Mở file:
pom.xml
Thêm dependency:
<dependency>
    <groupId>org.springframework.boot</groupId>
    <artifactId>spring-boot-starter-actuator</artifactId>
</dependency>
Build lại ứng dụng.
Bước 2. Thêm Micrometer
Thêm dependency:
<dependency>
    <groupId>io.micrometer</groupId>
    <artifactId>micrometer-registry-prometheus</artifactId>
</dependency>
Micrometer sẽ chuyển Metrics của Spring Boot sang định dạng Prometheus.
Bước 3. Cấu hình Actuator
Mở:
src/main/resources/application.yml
Thêm:
management:
  endpoints:
    web:
      exposure:
        include: health,prometheus

  endpoint:
    health:
      show-details: always

  metrics:
    tags:
      application: todo-api
Khởi động lại ứng dụng:
minikube image build -t todo-backend:v2 ./backend
kubectl rollout restart deployment todo-backend -n todo-app
Bước 4. Kiểm tra Endpoint
Port Forward:
kubectl port-forward deployment/todo-backend \
8080:8080 \
-n todo-app
Kiểm tra:
curl http://localhost:8080/actuator/health
Ví dụ:
{"status":"UP","components":{"db":{"status":"UP","details":{"database":"PostgreSQL","validationQuery":"isValid()"}},"diskSpace":{"status":"UP","details":{"total":86289817600,"free":15417856000,"threshold":10485760,"path":"/app/.","exists":true}},"livenessState":{"status":"UP"},"ping":{"status":"UP"},"readinessState":{"status":"UP"}},"groups":["liveness","readiness"]}
Tiếp tục:
curl http://localhost:8080/actuator/prometheus
Bạn sẽ thấy:
# HELP application_ready_time_seconds Time taken for the application to be ready to service requests
# TYPE application_ready_time_seconds gauge
application_ready_time_seconds{application="todo-api",main_application_class="com.example.todo.TodoApplication"} 7.196
...
jvm_buffer_memory_used_bytes{application="todo-api",id="direct"} 92160.0
jvm_buffer_memory_used_bytes{application="todo-api",id="mapped"} 0.0
jvm_buffer_memory_used_bytes{application="todo-api",id="mapped - 'non-volatile
...
jvm_memory_committed_bytes{application="todo-api",area="heap",id="Survivor Space"} 1835008.0
...
jvm_memory_max_bytes{application="todo-api",area="heap",id="Eden Space"} 7.1630848E7
...
jvm_threads_daemon_threads{application="todo-api"} 20.0
# HELP jvm_threads_live_threads The current number of live threads including both daemon and non-daemon threads
# TYPE jvm_threads_live_threads gauge
jvm_threads_live_threads{application="todo-api"} 24.0
...
logback_events_total{application="todo-api",level="debug"} 0.0
logback_events_total{application="todo-api",level="error"} 0.0
logback_events_total{application="todo-api",level="info"} 5.0
...
Điều này chứng tỏ ứng dụng đã export Metrics thành công.
Bước 5. Cấu hình Prometheus Scrape Application Metrics
5.1. Kiểm tra Service của Backend
Trước tiên cần biết tên Service mà Prometheus sẽ gọi.
Chạy:
kubectl get svc -n todo-app
Ví dụ:
NAME                    TYPE        CLUSTER-IP      EXTERNAL-IP   PORT(S)    AGE
todo-backend-service    ClusterIP   10.98.208.218   <none>        8080/TCP   4d23h
todo-frontend-service   ClusterIP   10.99.45.199    <none>        80/TCP     4d23h
todo-postgres-service   ClusterIP   10.97.106.35    <none>        5432/TCP   4d23h
Prometheus chạy bên trong Kubernetes nên không truy cập qua localhost.
Nó sẽ gọi Service thông qua Kubernetes DNS:
todo-backend-service.todo-app.svc.cluster.local
5.2. Tạo file cấu hình Prometheus
Tạo file:
touch monitoring/prometheus-values.yaml
Nội dung:
server:
  extraScrapeConfigs: |
    - job_name: todo-api

      metrics_path: /actuator/prometheus

      static_configs:
        - targets:
            - todo-backend-service.todo-app.svc.cluster.local:8080
Giải thích:
| Config | Ý nghĩa |
|---|---|
| job_name | Tên job trong Prometheus |
| metrics_path | Endpoint lấy Metrics |
| targets | Địa chỉ Spring Boot Application |
Prometheus sẽ gọi:
Prometheus
    ↓
todo-backend-service:8080
    ↓
/actuator/prometheus
5.3. Apply cấu hình bằng Helm
Update Prometheus:
helm upgrade prometheus \
prometheus-community/prometheus \
-f monitoring/prometheus-values.yaml \
-n monitoring
Kết quả:
Release "prometheus" has been upgraded. Happy Helming!
NAME: prometheus
LAST DEPLOYED: Tue Aug  4 10:36:20 2026
NAMESPACE: monitoring
STATUS: deployed
REVISION: 2
DESCRIPTION: Upgrade complete
TEST SUITE: None
NOTES:
The Prometheus server can be accessed via port 80 on the following DNS name from within your cluster:
prometheus-server.monitoring.svc.cluster.local
5.4. Kiểm tra Helm values
Kiểm tra:
helm get values prometheus -n monitoring
Bạn cần thấy:
USER-SUPPLIED VALUES:
server:
  extraScrapeConfigs: |
    - job_name: todo-api

      metrics_path: /actuator/prometheus

      static_configs:
        - targets:
            - todo-backend-service.todo-app.svc.cluster.local:8080
5.5. Kiểm tra Prometheus Pod
Helm sẽ tạo lại Prometheus Server.
Kiểm tra:
kubectl get pods -n monitoring
Ví dụ:
NAME                                                 READY   STATUS    RESTARTS      AGE
grafana-799c9d794-2qfvt                              1/1     Running   1 (20h ago)   3d17h
prometheus-alertmanager-0                            1/1     Running   1 (20h ago)   3d21h
prometheus-kube-state-metrics-76444ffd98-tbjq4       1/1     Running   2 (46m ago)   3d21h
prometheus-prometheus-node-exporter-rs4hg            1/1     Running   1 (20h ago)   3d21h
prometheus-prometheus-pushgateway-5df4b4d79b-tgzp9   1/1     Running   1 (20h ago)   3d21h
prometheus-server-dc466d8cc-tx8wh                    2/2     Running   2 (20h ago)   3d21h
5.6. Kiểm tra log Prometheus
Nếu cần debug:
kubectl logs \
deployment/prometheus-server \
-n monitoring
Không được có lỗi:
error loading config
Bước 6. Kiểm tra Prometheus Target
Mở Prometheus UI.
Port Forward:
kubectl port-forward \
svc/prometheus-server \
9090:80 \
-n monitoring
Truy cập browser:
http://localhost:9090
Đi tới trang targets:

Bạn sẽ thấy:

Điều này nghĩa là:
Prometheus
      ↓
Spring Boot Actuator
      ↓
Metrics OK
Bước 7. Kiểm tra Application Metrics
Trong Prometheus:
Chọn:
Graph
Query:
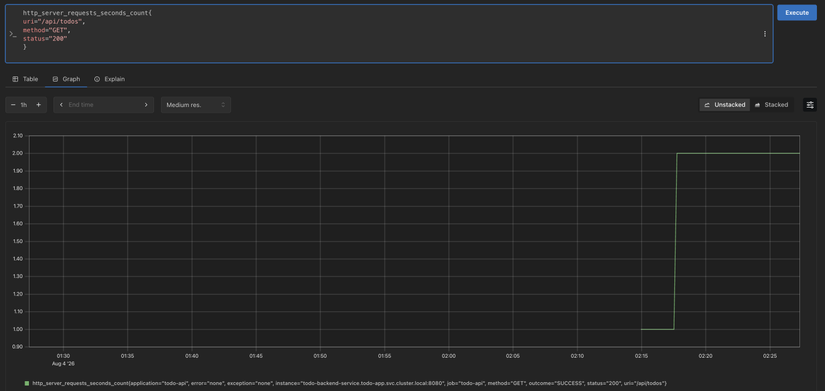
http_server_requests_seconds_count
Ví dụ:
http_server_requests_seconds_count{
uri="/api/todos",
method="GET",
status="200"
}
Kết quả chạy execute:
Ứng dụng Todo đã xử lý số request:
Bước 8. Request Rate
Tổng request không cho biết tốc độ.
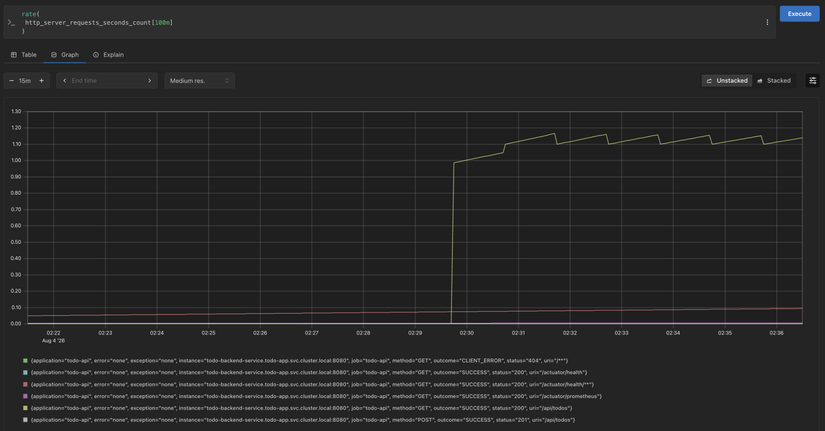
Chúng ta cần số request mỗi giây trong 100 phút gần nhất.
Query:
rate(
 http_server_requests_seconds_count[100m]
)
Kết quả:
Ý nghĩa:
- Ứng dụng đang nhận nhiều request hơn.
- Có thể dùng metric này để alert hoặc autoscaling.
Bước 9. Request Latency
Spring Boot lưu:
- Tổng thời gian xử lý request
- Số lượng request
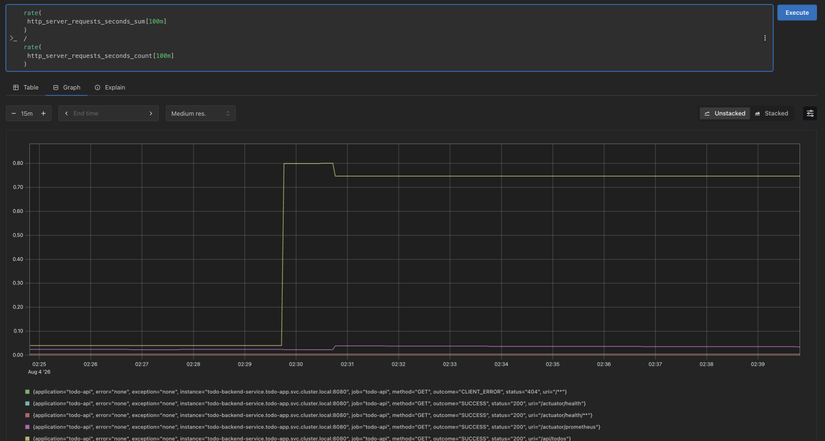
Công thức:
Average Latency = Total Request Time / Number of Requests
PromQL:
rate(
 http_server_requests_seconds_sum[1m]
)
/
rate(
 http_server_requests_seconds_count[1m]
)
Ví dụ:
Nếu:
CPU thấp
Memory còn nhiều
Latency cao
thì nguyên nhân thường nằm ở:
- Database
- External API
- Lock
- Connection Pool
Bước 10. Theo dõi HTTP Status Code
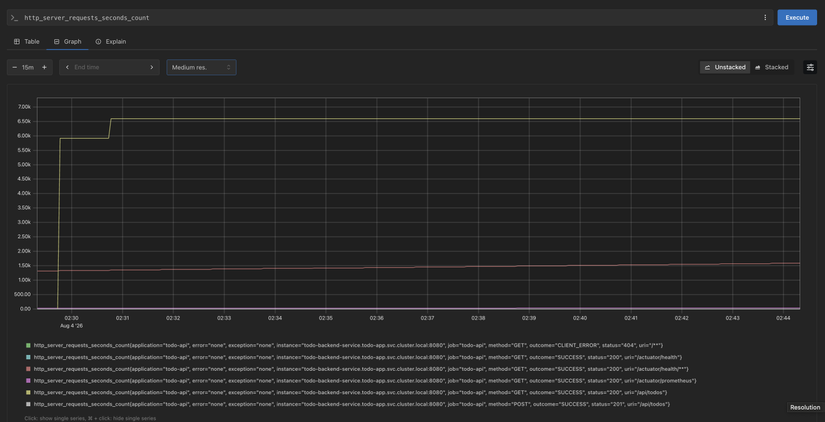
Query:
http_server_requests_seconds_count
Filter:
status="500"
Ví dụ:
status="200"   3200

status="500"   15

status="404"   8
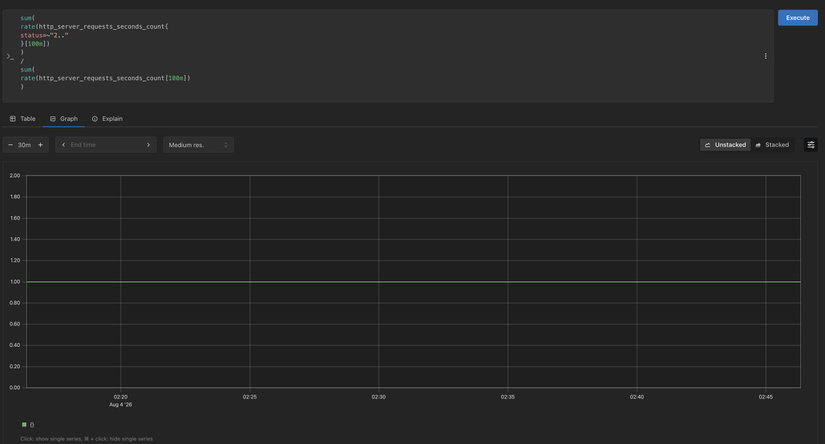
Trong production thường quan tâm:
Success Rate
sum(
rate(http_server_requests_seconds_count{
status=~"2.."
}[100m])
)
/
sum(
rate(http_server_requests_seconds_count[100m])
)
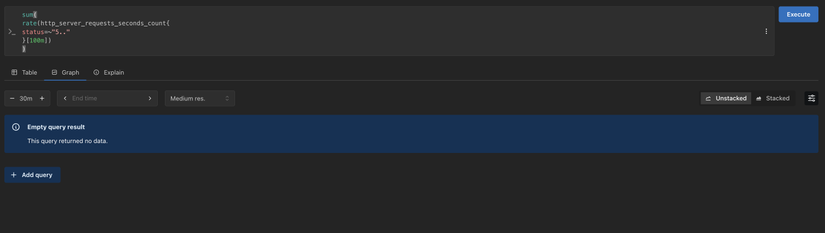
Error Rate
sum(
rate(http_server_requests_seconds_count{
status=~"5.."
}[100m])
)
Bước 11. JVM Memory
Query:
jvm_memory_used_bytes
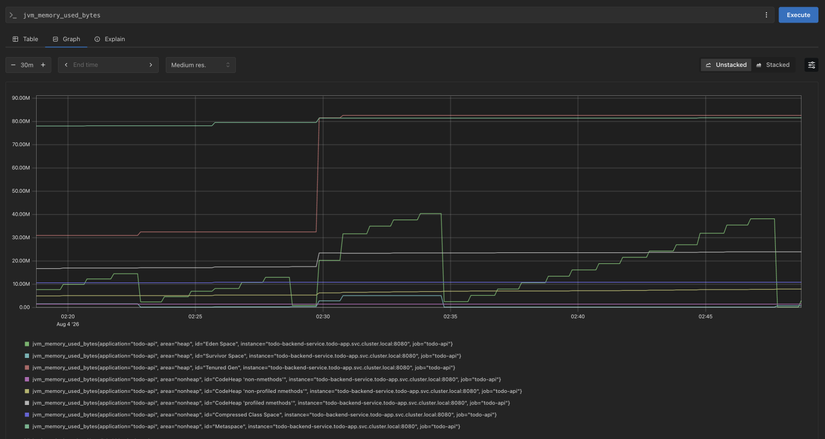
Mô tả:
- Eden Space (Xanh lá tươi): Tăng giảm dạng răng cưa liên tục do Minor GC định kỳ dọn dẹp các object ngắn hạn.
- Tenured Gen / Old Gen (Đỏ hồng): Nhảy vọt từ ~32MB lên ~80MB lúc 02:30 và đi ngang, chứa các object sống lâu.
- Non-Heap (Metaspace, CodeHeap, ...): Duy trì rất ổn định (tổng khoảng 35MB - 40MB), lưu thông tin class và JIT code.
Kết luận:
- Ứng dụng todo-api đang hoạt động bình thường, GC dọn dẹp bộ nhớ hiệu quả (không có dấu hiệu memory leak).
- Mức tăng Tenured Gen lúc 02:30 là do ứng dụng bắt đầu chịu tải cao hơn hoặc vừa load dữ liệu cố định vào bộ nhớ.
Bước 12. Garbage Collector
Query:
jvm_gc_pause_seconds_count
Kết quả:
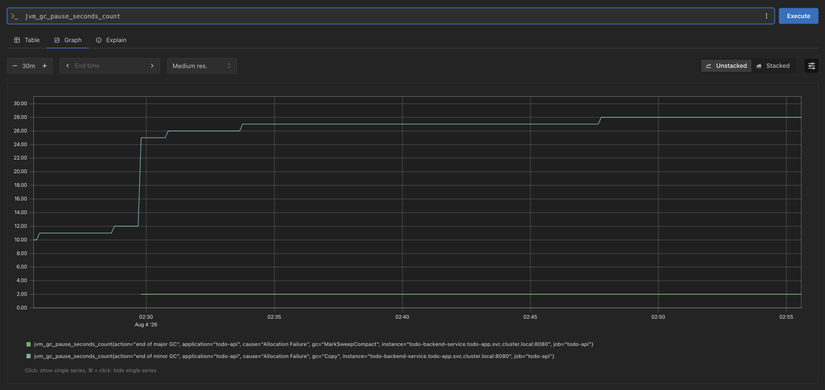
GC tăng nhanh nghĩa là:
- JVM phải dọn rác nhiều hơn.
- CPU có thể tăng.
- Request latency có thể tăng.
Bước 13. JVM Thread
Query:
jvm_threads_live_threads
Kết quả:
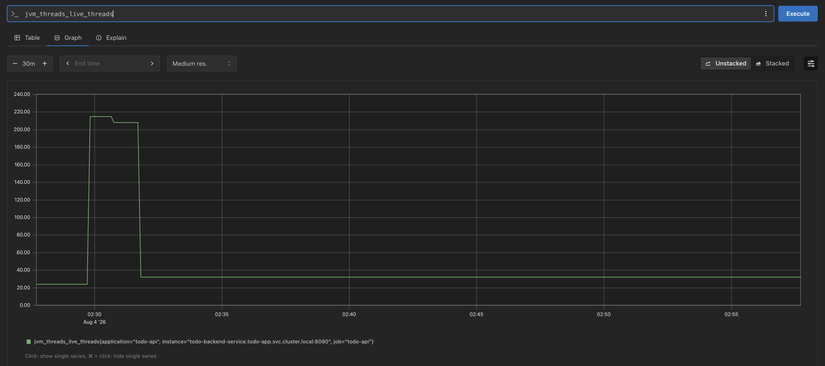
Nếu tăng liên tục:
100
200
500
có thể do:
- Thread leak
- Không đóng connection
- Tải quá lớn
Bước 14. Tạo Application Dashboard trên Grafana
Mở Grafana:
http://localhost:3000
Chọn:
Dashboard
    ↓
New Dashboard
Thêm các Panel:
HTTP
Request Rate
Metric:
rate(http_server_requests_seconds_count[1m])
Latency
rate(http_server_requests_seconds_sum[1m])
/
rate(http_server_requests_seconds_count[1m])
HTTP Error
rate(http_server_requests_seconds_count{
status=~"5.."
}[1m])
JVM
Heap
jvm_memory_used_bytes
GC
jvm_gc_pause_seconds_count
Threads
jvm_threads_live_threads
Kubernetes
Giữ thêm:
- CPU Pod
- Memory Pod
- Restart Count
Bước 15. Load Test Application
Cài Apache Benchmark:
macOS:
brew install httpd
Chạy:
ab -n 10000 -c 100 \
http://localhost:8080/api/todos
Hoặc dùng k6:
k6 run script.js
Quan sát Grafana:
Request:
10 req/s
        ↓
100 req/s
Latency:
30ms
 ↓
200ms
JVM:
Heap tăng
GC:
GC tăng
Nếu vượt giới hạn:
HPA Scale Up
Bước 16. Tạo lỗi để kiểm tra Monitoring
Sửa tạm API:
@GetMapping("/api/todos")
public List<Todo> getTodos(){

    throw new RuntimeException();

}
Deploy lại.
Gọi API:
curl http://localhost:8080/api/todos
Kết quả:
HTTP 500
Quan sát Dashboard:
HTTP 500:
0
 ↓
10
 ↓
100
Latency:
50ms
 ↓
500ms
Developer có thể thấy lỗi ngay lập tức.
Debug lỗi thường gặp
Không có Metrics
Kiểm tra:
curl http://localhost:8080/actuator/prometheus
Nếu lỗi:
Kiểm tra:
Actuator dependency
spring-boot-starter-actuator
Micrometer
micrometer-registry-prometheus
Exposure
management:
  endpoints:
    web:
      exposure:
        include: health,prometheus
Target DOWN
Vào:
Prometheus

↓

Status

↓

Targets
Kiểm tra:
todo-api DOWN
Debug:
kubectl get svc -n todo-app
Kiểm tra DNS:
kubectl exec -it prometheus-server \
-n monitoring -- sh
Test:
wget -O- \
http://todo-backend-service.todo-app.svc.cluster.local:8080/actuator/prometheus
Dọn dẹp
Nếu muốn xóa cấu hình:
helm upgrade prometheus \
prometheus-community/prometheus \
-n monitoring
hoặc xóa file:
prometheus-values.yaml
Những gì đã học
Sau Lab này:
✅ Spring Boot Actuator ✅ Micrometer ✅ Prometheus Application Metrics ✅ Request Rate ✅ Request Latency ✅ HTTP Error Monitoring ✅ JVM Heap Monitoring ✅ Garbage Collector Monitoring ✅ Thread Monitoring ✅ Application Dashboard
Bài học rút ra
Infrastructure Monitoring trả lời:
"Kubernetes có khỏe không?"
Application Monitoring trả lời:
"Ứng dụng có đang phục vụ người dùng tốt không?"
Khi kết hợp:
Kubernetes Metrics
        +
Application Metrics
        +
Business Metrics
DevOps có thể nhanh chóng tìm ra nguyên nhân:
- API chậm
- Database chậm
- Memory Leak
- JVM quá tải
- Error tăng cao
Ở Lab 8, chúng ta sẽ xây dựng Alerting System:
- CPU cao → gửi cảnh báo
- Pod restart liên tục → cảnh báo
- HTTP 5xx tăng → cảnh báo
- Application latency vượt ngưỡng → cảnh báo
Thay vì phải mở Grafana liên tục, hệ thống sẽ chủ động thông báo sự cố.
All Rights Reserved