Banking Demo - Phase 5 : Refactor kiến trúc — Cải thiện hệ thống để test tải với 1000 CCU
Mở đầu
Ở bài trước, chúng ta đã refactor kiến trúc Phase 5:
- tách namespace
- Kong DB mode
- Postgres/Redis HA.
- Kiến trúc mới chạy ổn, nhưng khi chạy load test —
seed_users.pytạo hàng trăm users, k6 bắn request liên tục — mới lộ vấn đề: request ồ ạt đổ thẳng vào backend, auth-service, account-service, transfer-service bị quá tải, latency tăng vọt, 5xx xuất hiện.
Nếu các bạn theo dõi series này và lab theo thì sẽ thấy đây là điểm chưa ổn.
Thế nên, tôi đã chuẩn bị cho phần tiếp theo ở đây.
Bài này nói về tuning — cụ thể là thêm RabbitMQ nằm giữa Kong và backend để đệm request, tránh flood trực tiếp vào các service. Đây chính là bước chuyển sang Phase 8 kiến trúc message queue.
Repo : https://github.com/kevinram164/banking-demo.git
Review lại phần trước.
Như đã nói, nếu các bạn đã thực hành đến bước đó rồi, dùng K6 để load test, thì số lượng req lỗi là nhiều.
Có bạn sẽ nghĩ đến việc là Scale thêm pods để chịu tải 
Nhưng như thế không phải là cách hay, vì khi chúng ta scale thêm thì chính DB sẽ là nơi phải chịu tải, là điểm bị bottle neck.
Vì sao ư? Vì bản thân các services đều gọi đến DB mà, đúng không?
Xem kỹ file common/db.py này nhé :
import os
from sqlalchemy import create_engine
from sqlalchemy.orm import sessionmaker, DeclarativeBase
from typing import TYPE_CHECKING

if TYPE_CHECKING:
    from logging import Logger

DATABASE_URL = os.getenv("DATABASE_URL")
# Pool: 500 max_connections / ~20 pods ≈ 25 per pod. Env để tune khi scale.
POOL_SIZE = int(os.getenv("DB_POOL_SIZE", "15"))
MAX_OVERFLOW = int(os.getenv("DB_MAX_OVERFLOW", "5"))

if DATABASE_URL and DATABASE_URL.startswith("postgresql://"):
    DATABASE_URL = DATABASE_URL.replace("postgresql://", "postgresql+psycopg://", 1)

engine = create_engine(
    DATABASE_URL,
    future=True,
    pool_pre_ping=True,
    pool_size=POOL_SIZE,
    max_overflow=MAX_OVERFLOW,
    pool_timeout=30,
    pool_recycle=600,
)
SessionLocal = sessionmaker(bind=engine, autoflush=False, autocommit=False, future=True)


def log_db_pool_status(logger: "Logger | None" = None) -> None:
    """Log DB pool status at startup."""
    if not logger or not DATABASE_URL:
        return
    try:
        from common.logging_utils import log_event
        log_event(logger, "db_pool_ready", pool_size=POOL_SIZE, max_overflow=MAX_OVERFLOW)
    except Exception:
        pass


class Base(DeclarativeBase):
    pass
Tiếp nhé :
1. Vấn đề: Load test làm backend quá tải
Phase 5 — Kong route trực tiếp tới backend
User → Ingress → Kong → auth-service / account-service / transfer-service
Kong nhận HTTP, route theo path (/api/auth, /api/account, …) rồi gọi thẳng tới từng service.
Mỗi request = 1 HTTP call đồng bộ tới backend.
Chuyện gì xảy ra khi load test?
seed_users.pychạy 500 users, 20 luồng song song → 500 request đăng ký gửi gần như đồng thời.- k6 chạy 20 VUs, mỗi VU gọi login/transfer liên tục → hàng chục RPS dồn vào auth, transfer.
Backend (auth, account, transfer) nhận burst — nhiều request cùng lúc, connection pool PostgreSQL/Redis cạn, CPU tăng, response chậm --> Client timeout, retry, request càng dồn thêm --> Kết quả: quá tải, error rate tăng, hệ thống không ổn định.
HPA/KEDA có thể scale pod lên, nhưng scale cần thời gian — pod mới khởi động vài chục giây.
Trong lúc đó, request vẫn đổ ồ ạt vào các pod cũ.
Vấn đề không phải thiếu replica, mà là không có lớp đệm giữa gateway và backend.
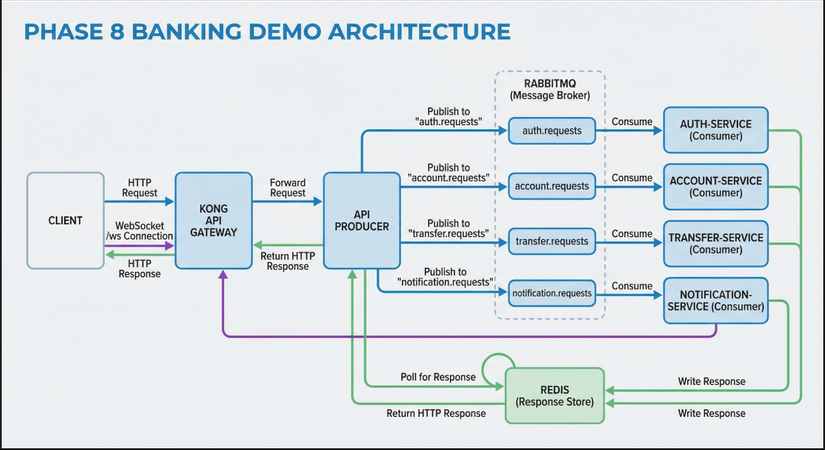
2. Giải pháp tuning: Thêm RabbitMQ giữa Kong và backend
Ý tưởng
Thay vì Kong gọi trực tiếp backend, ta chèn một message queue (RabbitMQ) ở giữa:
- Kong nhận HTTP → gửi tới API Producer (FastAPI).
- API Producer publish request vào RabbitMQ (queue
auth.requests,account.requests, …) rồi chờ response qua Redis. - Consumers (auth, account, transfer, notification) consume từ queue, xử lý, ghi response vào Redis.
- Producer đọc response từ Redis, trả HTTP cho client.
User → Ingress → Kong → API Producer → RabbitMQ (queue)
                                           ↓
                    auth-consumer, account-consumer, ... (xử lý theo tốc độ riêng)
                                           ↓
                    Redis (response) ← Producer đọc → trả HTTP
Tại sao đây là tuning?
- Queue đệm request: Khi traffic burst, request không đổ thẳng vào backend mà vào queue. RabbitMQ giữ message, consumers lấy ra xử lý theo tốc độ của mình.
- Backpressure tự nhiên: Nếu consumers chậm, queue dài lên — không làm crash backend. Client (Producer) chờ response với timeout; nếu quá lâu có thể trả 504.
- Tách biệt tốc độ: Kong/Producer có thể nhận request rất nhanh (chỉ cần publish), còn consumers xử lý chậm hơn mà không ảnh hưởng gateway.
Kiến trúc Phase 8
| Thành phần | Vai trò |
|---|---|
| Kong | Route /api/* → api-producer:8080, /ws → notification-service:8004 |
| API Producer | Nhận HTTP, map path → queue, publish → RabbitMQ, chờ Redis, trả HTTP |
| RabbitMQ | Queue auth.requests, account.requests, transfer.requests, notification.requests |
| Consumers | auth-service, account-service, transfer-service, notification-service — consume queue, xử lý, ghi response Redis |
WebSocket /ws đi trực tiếp tới notification-service (không qua queue) vì cần real-time.
Kết quả
Sau khi thêm RabbitMQ, load test lại — request vẫn burst nhưng không còn flood trực tiếp vào auth/account/transfer. Queue hấp thụ traffic, consumers xử lý ổn định. Latency có thể tăng một chút (thêm hop qua queue + Redis), nhưng error rate giảm, hệ thống ổn định hơn. Đó chính là tuning — điều chỉnh kiến trúc để chịu tải tốt hơn.
3. Các tuning bổ trợ
Ngoài RabbitMQ, còn một số điều chỉnh hỗ trợ hệ thống chạy tốt hơn.
3.1. Resource Requests & Limits
Sau khi tách namespace, mỗi thành phần chạy độc lập. Nếu không đặt requests và limits, Kubernetes sẽ không biết pod cần bao nhiêu tài nguyên, dễ dẫn tới:
- Pod bị OOMKilled khi memory tăng đột biến
- Node quá tải vì nhiều pod cùng ăn CPU
- Scheduler không tối ưu vì thiếu thông tin
Cấu hình mẫu trong Helm values
App services (auth, account, transfer, notification):
resources:
  requests:
    memory: "128Mi"
    cpu: "100m"
  limits:
    memory: "512Mi"
    cpu: "2000m"
requests: đảm bảo pod được cấp ít nhất 128Mi RAM, 100m CPU — giúp QoS class Guaranteed/Burstable, tránh bị evict khi node thiếu tài nguyên.limits: ngăn pod vượt quá 512Mi/2 CPU — nếu vượt, bị throttle (CPU) hoặc OOMKilled (memory).
API Producer (Phase 8):
resources:
  requests:
    memory: "128Mi"
    cpu: "100m"
  limits:
    memory: "512Mi"
    cpu: "500m"
Producer chỉ làm HTTP → publish → wait Redis, nên CPU limit thấp hơn (500m). Nếu load cao, scale thêm replica.
Kong (Phase 5 HA):
resources:
  requests:
    memory: "256Mi"
    cpu: "100m"
  limits:
    memory: "1Gi"
    cpu: "500m"
Kong làm gateway, nhận mọi traffic — RAM cần cao hơn để buffer, CPU vừa phải vì chủ yếu I/O.
PostgreSQL primary/replica:
primary:
  resources:
    requests:
      memory: "256Mi"
      cpu: "100m"
    limits:
      memory: "512Mi"
      cpu: "500m"
Redis master/replica (Bitnami chart): persistence 20Gi mỗi node, metrics exporter 32Mi/50m → 64Mi/200m.
Trade-offs
- Requests thấp: dễ schedule, tiết kiệm tài nguyên, nhưng có thể thiếu khi burst.
- Limits cao: cho phép burst tốt, nhưng một pod “điên” có thể chiếm hết node.
- requests = limits: QoS Guaranteed, ít bị evict nhất, nhưng không tận dụng burst.
Với banking-demo, chúng ta chọn requests thấp, limits vừa phải — đủ cho workload thường ngày, vẫn có headroom khi load tăng, và dựa vào HPA/KEDA để scale thay vì “phình” từng pod.
3.2. Scaling — HPA vs KEDA
HPA (Horizontal Pod Autoscaler)
HPA scale theo CPU và Memory — metrics có sẵn từ metrics-server, không cần Prometheus.
apiVersion: autoscaling/v2
kind: HorizontalPodAutoscaler
metadata:
  name: auth-service
  namespace: banking
spec:
  scaleTargetRef:
    apiVersion: apps/v1
    kind: Deployment
    name: auth-service
  minReplicas: 1
  maxReplicas: 5
  metrics:
    - type: Resource
      resource:
        name: cpu
        target:
          type: Utilization
          averageUtilization: 70
    - type: Resource
      resource:
        name: memory
        target:
          type: Utilization
          averageUtilization: 80
  behavior:
    scaleDown:
      stabilizationWindowSeconds: 120
      policies:
        - type: Percent
          value: 50
          periodSeconds: 60
    scaleUp:
      stabilizationWindowSeconds: 0
      policies:
        - type: Percent
          value: 100
          periodSeconds: 15
- scaleUp: nhanh (0s stabilization, 100% mỗi 15s) — phản ứng kịp khi load tăng.
- scaleDown: chậm (120s stabilization, 50% mỗi 60s) — tránh scale xuống rồi lại scale lên liên tục.
Lưu ý: Chỉ dùng HPA hoặc KEDA cho một Deployment, không dùng cả hai cùng lúc.
KEDA (scale theo RPS)
KEDA scale theo Prometheus query — ví dụ RPS (requests per second). Phù hợp khi CPU chưa kịp tăng mà traffic đã tới.
apiVersion: keda.sh/v1alpha1
kind: ScaledObject
metadata:
  name: auth-service-scaler
  namespace: banking
spec:
  scaleTargetRef:
    name: auth-service
  minReplicaCount: 2
  maxReplicaCount: 5
  cooldownPeriod: 120
  triggers:
    - type: prometheus
      metadata:
        serverAddress: http://kube-prometheus-stack-prometheus.monitoring.svc.cluster.local:9090
        query: sum(rate(http_requests_total{job="auth-service",endpoint!="/health"}[2m]))
        threshold: "5"
        activationThreshold: "1"
endpoint!="/health": loại trừ probe Kubernetes để tránh scale nhầm khi chỉ có health check.threshold: "5": RPS > 5 → scale up.activationThreshold: "1": có ít nhất 1 request → bắt đầu scale (tránh scale về 0 nếu minReplicaCount > 0).
Phase 8: Scale api-producer thay vì consumers
Phase 8: Kong → api-producer → RabbitMQ → consumers. Consumers không expose HTTP (chỉ health port 9999), nên KEDA query job="auth-service" sẽ không có dữ liệu. Cần chuyển scaling sang api-producer:
- Tạo
ScaledObjectchoapi-producer, query:sum(rate(http_requests_total{job="api-producer",endpoint!="/health"}[2m])). - Consumers (auth, account, transfer, notification) có thể giữ HPA (CPU/Memory) hoặc scale cố định nếu queue chưa đủ để dùng KEDA RabbitMQ scaler.
3.3. Kong — nginx workers & replicas
Phase 5 Kong chạy DB mode, có thể scale replica. Trong values-kong-ha.yaml:
replicaCount: 2

env:
  nginx_worker_processes: "2"
- replicaCount: 2: 2 pod Kong proxy — HA, load balancing qua Service.
- nginx_worker_processes: "2": mỗi pod 2 worker process — tận dụng CPU đa nhân. Phase 2 dùng
"1", Phase 5 tăng lên vì traffic qua gateway nhiều hơn.
Nếu cluster có nhiều CPU, có thể tăng nginx_worker_processes lên 4; không nên vượt quá số core của node.
3.4. Redis HA — replicas, Sentinel, persistence
values-redis-ha.yaml:
architecture: replication

master:
  persistence:
    enabled: true
    size: 20Gi
    storageClass: nfs-client

replica:
  replicaCount: 3
  persistence:
    enabled: true
    size: 20Gi
    storageClass: nfs-client

sentinel:
  enabled: true
  replicas: 3
- 3 replicas: read scale-out, failover nhanh.
- 3 sentinels: quorum đủ để bầu master mới khi master chết.
- Persistence 20Gi: đủ cho session + response cache; nếu dữ liệu tăng, tăng
size.
App kết nối qua redis://redis-master.redis.svc.cluster.local:6379 — Sentinel tự trỏ redis-master tới node đang là master.
3.5. PostgreSQL HA — primary + read replica
architecture: replication

primary:
  replicaCount: 1
  persistence:
    enabled: true
    size: 1Gi
    storageClass: nfs-client

readReplicas:
  replicaCount: 1
- 1 primary + 1 read replica: đọc có thể chia sang replica (nếu app hỗ trợ). Banking-demo hiện dùng primary cho cả read/write.
- 1Gi mỗi node: đủ cho demo; production nên tăng và theo dõi disk usage qua postgres-exporter.
3.6. Phase 8 — RabbitMQ & observability
RabbitMQ (đã thêm ở mục 2 — tuning chính)
Cấu hình RabbitMQ hỗ trợ ổn định:
- prefetch_count (consumer): giới hạn số message chờ xử lý mỗi consumer — tránh một consumer nhận quá nhiều, consumer khác đói.
- Durable queue:
durable=Truetrongrabbitmq_utils.py— queue tồn tại khi RabbitMQ restart. - Persistence: RabbitMQ persistence bật khi cài qua Helm/manifest — message không mất khi restart.
Resource (ví dụ k8s-rabbitmq-standalone.yaml):
resources:
  limits:
    memory: 1Gi
    cpu: "1000m"
  requests:
    memory: 256Mi
    cpu: "100m"
Observability Phase 8
Phase 8 chỉ api-producer expose /metrics — consumers (auth, account, transfer, notification) không có FastAPI, chỉ consume từ queue. Do đó:
- Prometheus scrape: thêm job
api-producertạiapi-producer.banking.svc.cluster.local:8080. - Grafana dashboard: dùng
grafana-dashboard-banking-services-phase8.yaml— panels đọcjob="api-producer"vàendpoint=~"/api/auth.*|/api/account.*|..."để tách RPS theo từng service logic.
kubectl apply -f phase3-monitoring-keda/helm-monitoring/grafana-dashboard-banking-services-phase8.yaml
3.7. Monitoring stack — Prometheus, Grafana, Loki, Tempo
Scrape config (Phase 5 + Phase 8)
values-kube-prometheus-stack.yaml khai báo:
| Job | Target | Ghi chú |
|---|---|---|
| auth-service | :8001 | Phase 5 — trực tiếp |
| account-service | :8002 | Phase 5 |
| transfer-service | :8003 | Phase 5 |
| notification-service | :8004 | Phase 5 |
| api-producer | :8080 | Phase 8 — entry point HTTP |
| kong | kong-kong-admin.kong:8001 | Kong metrics |
| redis | redis-metrics.redis:9121 | redis-exporter |
| postgres | postgres-postgresql-primary-metrics.postgres:9187 | postgres-exporter |
Grafana dashboards
| Phase | File | Mô tả |
|---|---|---|
| Phase 5 | grafana-dashboard-banking-services.yaml |
auth/account/transfer/notification expose HTTP |
| Phase 8 | grafana-dashboard-banking-services-phase8.yaml |
api-producer nhận HTTP, RPS theo endpoint |
Logging — Loki + Promtail
- Loki: lưu log từ Promtail.
- Promtail: thu thập log pod, gửi về Loki.
- App log JSON (qua
logging_utils.py),LOG_LEVELcấu hình qua env — dễ filter trong Grafana.
Tracing — OTLP → Tempo
App set OTEL_EXPORTER_OTLP_ENDPOINT → gửi trace qua OTLP gRPC tới OpenTelemetry Collector → export sang Tempo. Grafana Explore chọn datasource Tempo để xem trace theo request.
3.8. SLO & Alerting
Phase 7 có tài liệu phase7-security-reliability/sre/SLO-ALERTING.md. Gợi ý SLO đơn giản:
Availability
- SLO: 99% request không trả 5xx (30 ngày).
- Error rate (PromQL):
sum(rate(http_requests_total{job="auth-service",status=~"5.."}[5m]))
/ ignoring(status)
sum(rate(http_requests_total{job="auth-service"}[5m]))
Latency
- SLO: P95 < 300ms (30 ngày).
- P95 (PromQL):
histogram_quantile(
  0.95,
  sum(rate(http_request_duration_seconds_bucket[5m])) by (le)
)
Alert rule mẫu
groups:
  - name: banking-slo
    rules:
      - alert: HighErrorRateAuth
        expr: |
          (
            sum(rate(http_requests_total{job="auth-service",status=~"5.."}[5m]))
            / ignoring(status)
            sum(rate(http_requests_total{job="auth-service"}[5m]))
          ) > 0.05
        for: 10m
        labels:
          severity: warning

      - alert: HighLatencyP95
        expr: |
          histogram_quantile(
            0.95,
            sum(rate(http_request_duration_seconds_bucket[5m])) by (le)
          ) > 0.3
        for: 10m
        labels:
          severity: warning
Phase 8: thay job="auth-service" bằng job="api-producer" nếu toàn bộ API đi qua producer.
Kiểm chứng, không anh em lại bảo tôi nói điêu  )
)
- Số lượng pods tôi dùng :
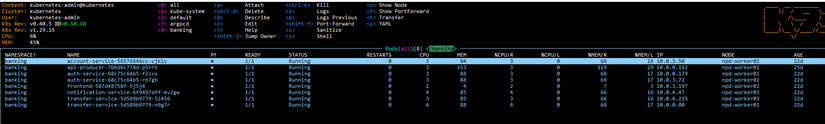 Mỗi services là 1 pod.
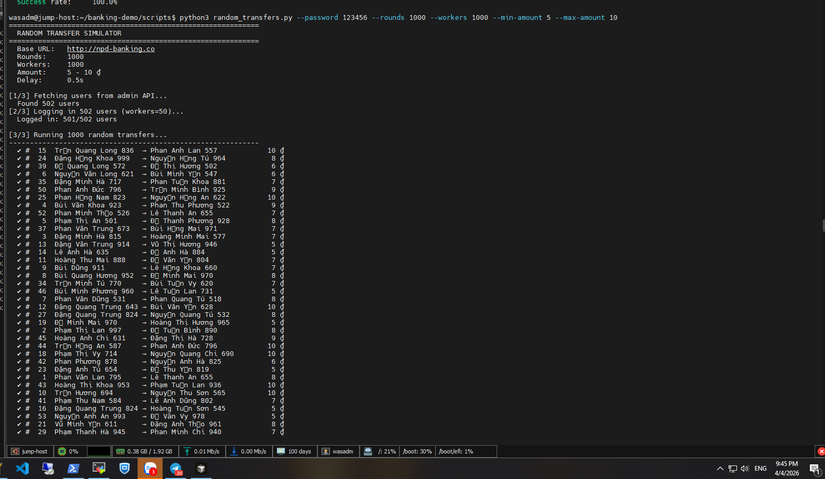
 - Tôi test lần 1 với 500 workers:
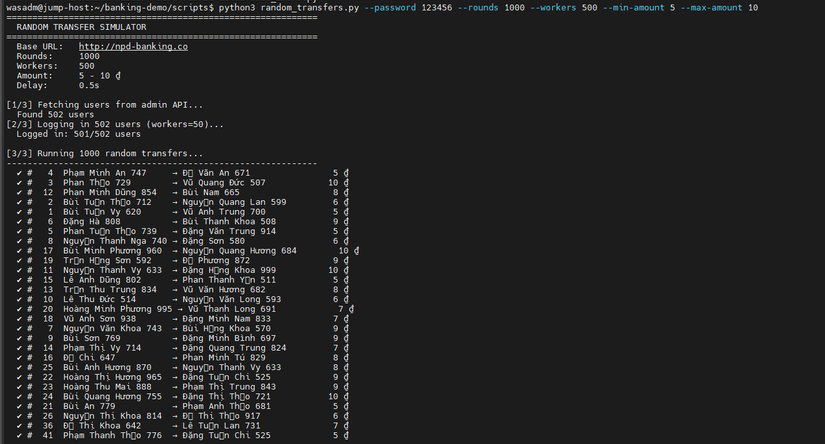
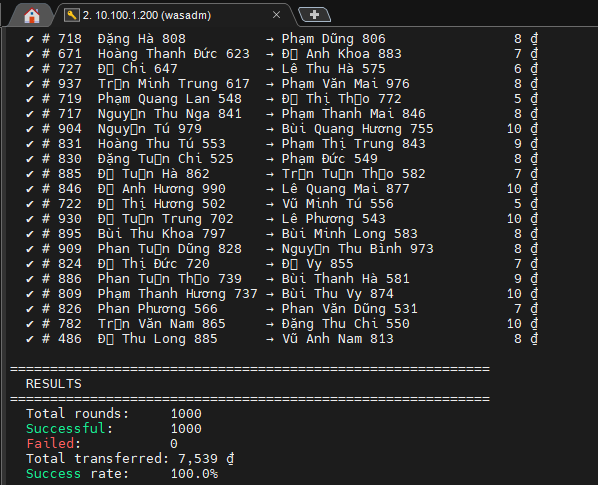
Lần 2 với 1000 workers : (lần này có chụp hẳn hoi cả date + time nhé, không là có ae sẽ k tin)
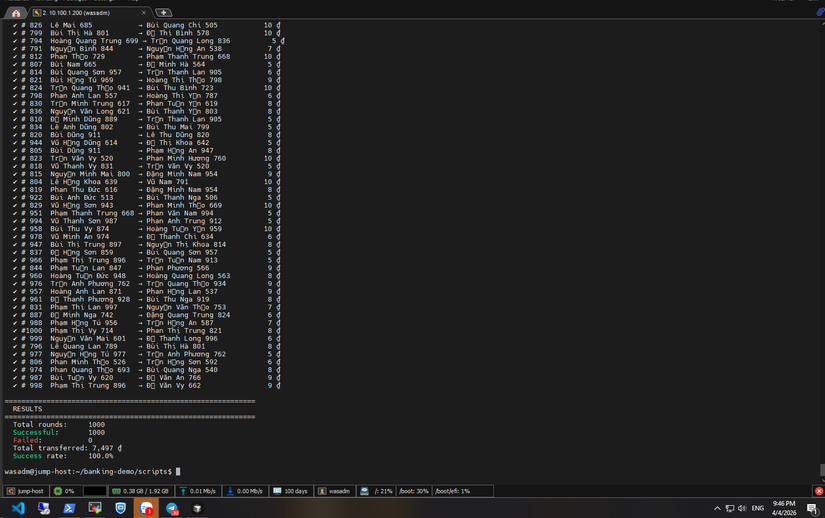
- Check trên grafana :
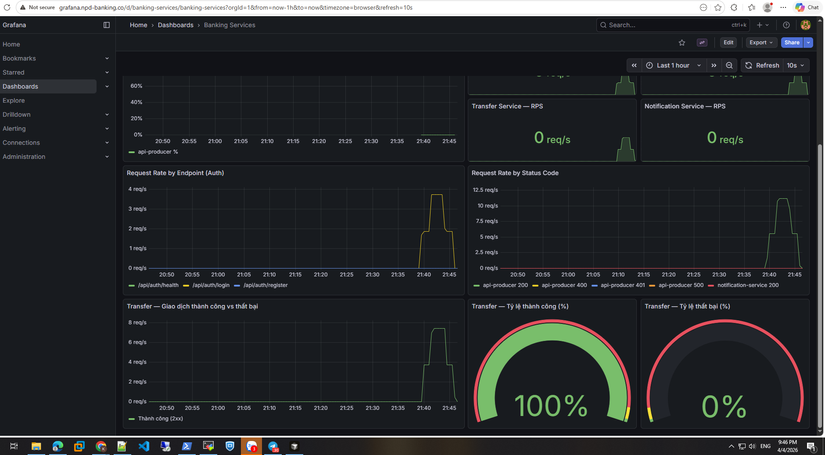
100% giao dịch thành công nha ae.
Giờ check log giao dịch :
- Log cho api-producer:
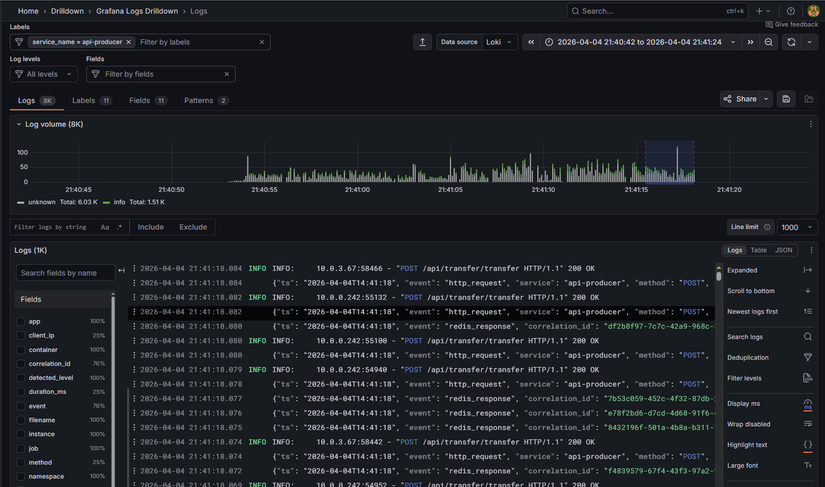
- Log cho transfers:
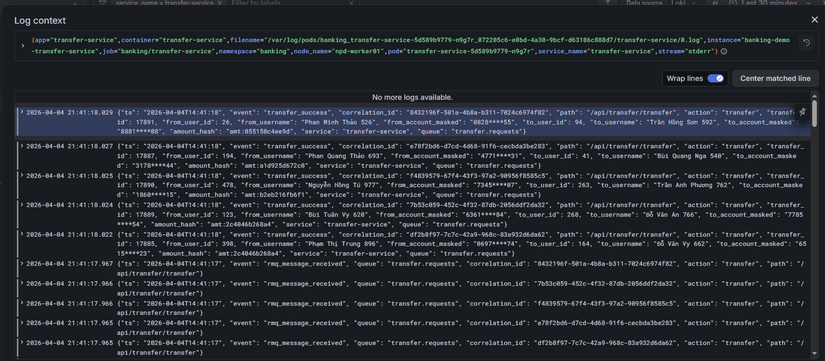 Anh em có để ý là log của transfer nó như này :
{"ts": "2026-04-04T14:41:18", "event": "transfer_success", "correlation_id": "8432196f-501a-4b8a-b311-7024c6974f82", "path": "/api/transfer/transfer", "action": "transfer", "transfer_id": 17891, "from_user_id": 26, "from_username": "Phan Minh Thảo 526", "from_account_masked": "0828****55", "to_user_id": 94, "to_username": "Trần Hồng Sơn 592", "to_account_masked": "8881****08", "amount_hash": "amt:055150c4ee9d", "service": "transfer-service", "queue": "transfer.requests"}
Phần stk, số tiền đã được mã hóa. Đây là theo chuẩn format của bank nha anh em.
-
Log cho authen:
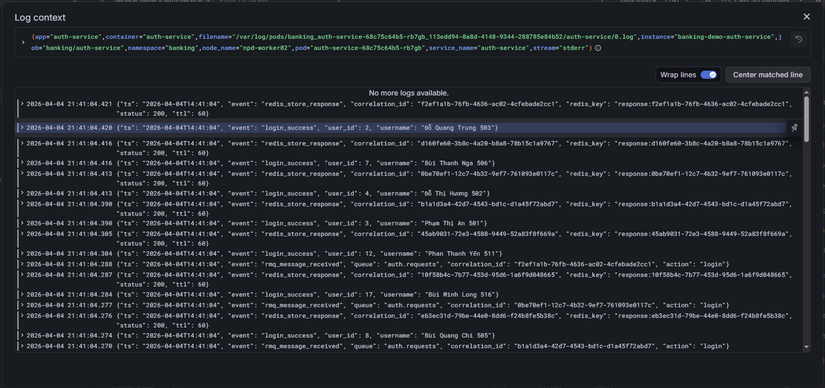
-
Tracing luôn process transfer cho anh em xem :
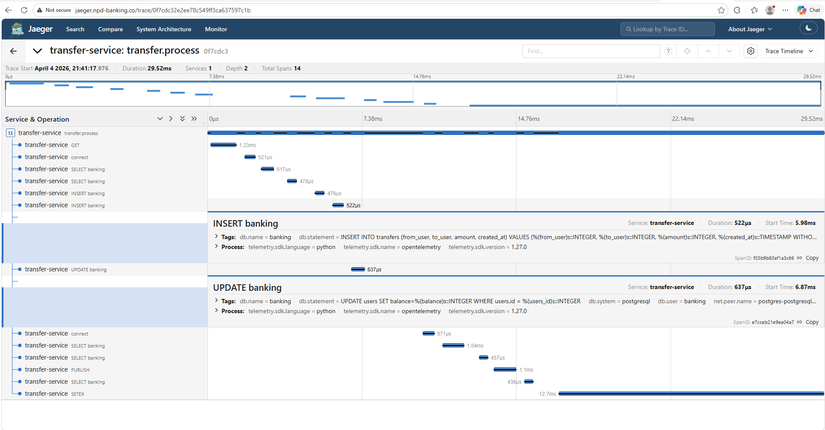 Xem thì anh em sẽ thấy 1 process chuyển tiền mất 29ms, rất nhanh đúng k nào
Còn phần nặng nhất là authen :
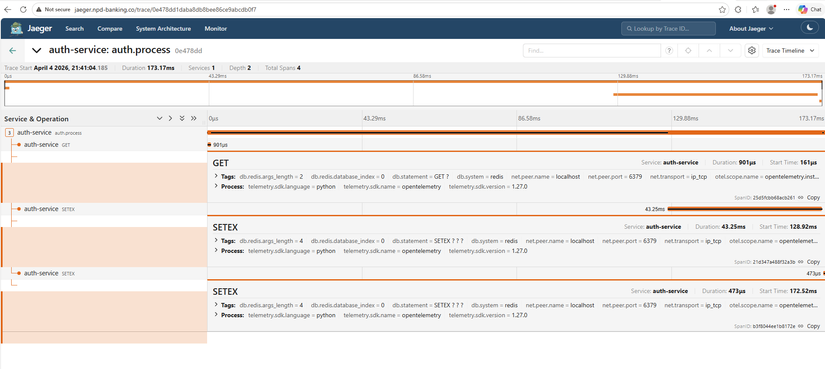 Anh em xem nhé, nó chỉ mất có 173ms cho 1 process, mà chủ yếu là call đến Redis nhé --> Tác dụng của redis là đây
Tôi dám chắc với anh em là anh em đã lab đến phần này là rất ok rồi đó )
Tóm tắt
Phase 5 Part 2 — Tuning hệ thống bắt nguồn từ vấn đề thực tế: load test làm request ồ ạt đổ vào backend, auth/account/transfer quá tải. Giải pháp chính là thêm RabbitMQ giữa Kong và backend — queue đệm request, consumers xử lý theo tốc độ riêng, không còn flood trực tiếp. Đó chính là kiến trúc Phase 8.
Các tuning bổ trợ: resource requests/limits, HPA/KEDA (Phase 8 scale api-producer), Kong nginx workers, Redis/Postgres HA, monitoring (Prometheus, Grafana Phase 8 dashboard), SLO & alerting.
Sau khi tuning, chạy lại load test (seed_users.py, k6) — request vẫn burst nhưng queue hấp thụ, error rate giảm, hệ thống ổn định hơn.
Đợt này tôi cũng bận, nên cũng đang ấp ủ phần Security, nhưng chắc sẽ lâu lâu mới ra bài mới. Nhưng trong repo cũng có nhiều thứ mà tôi đã thêm trong đó rồi, anh em cứ nghiên cứu dần nhé.
All Rights Reserved